
Share this @internewscast.com
Astrophysicists may not have cracked time travel, but over here in the world of personal finance we’ve known how to do it for years.
After all, doesn’t the skill of managing money allow you to move it around through time?
You can spend future earnings now by borrowing money. You can bring things from your future – a home or a car – into your present by buying with debt and paying it off bit by bit until you’re the owner.
And you can throw wealth forward into the future through investments so that a pot of money is ready for you whenever you need it.
However, ensuring cash is there for you when the time comes isn’t as simple as not spending it in the present – with inflation all but guaranteeing what you have now will be worth less in the future. That’s where we come unstuck.
So you have to use it to invest in things that will rise in value as quickly as inflation – and if you want to grow your wealth, you must outperform it.

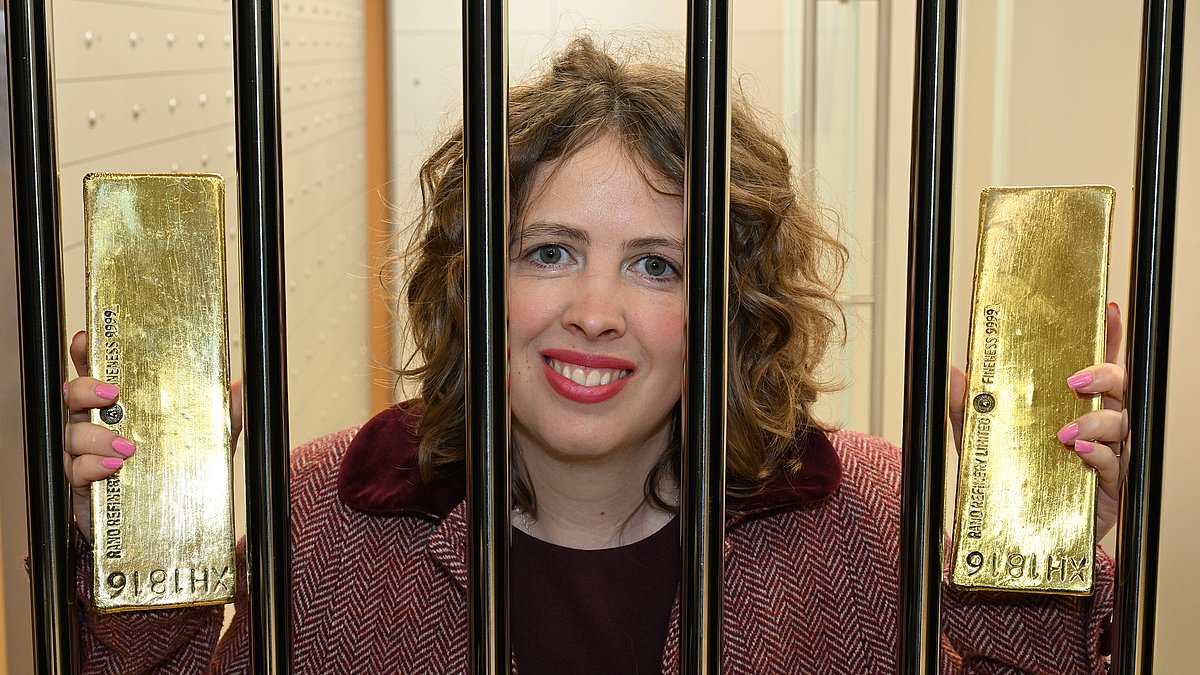
Behind bars: Rachel at gold storage facility IBV International Vaults London in Mayfair
There are typically well-worn ways of doing this that we’ve come to trust.
A balanced portfolio of shares and bonds usually ought to beat inflation over the long term – either by providing an income or by rising in value over time.
But in times of chaos, as seen with President Donald Trump’s tariff announcements, the path between the now and what we’re saving towards becomes obscured.
It’s easy to start doubting the tried and tested strategy of spreading your risk across different investments when it hasn’t fully protected wealth. Even if you held a portfolio containing thousands of companies all around the world you’d still have lost about 10 per cent over the past three months.
If you’d held just 40 per cent in shares and 60 per cent in supposedly safer bonds, you’d still have lost money.
A shares and bonds strategy is very likely to succeed in the long term, but it’s easy to lose sight of that when the outlook in front of you is shaky.
At times like these, we are less comfortable setting store by what could be and instead cling to what is certain.
Inside the super safe gold vaults
So I was not surprised to learn that not only is the gold price hitting record highs, but demand for physical gold is also going through the roof.
Last week I visited IBV International Vaults London in Mayfair, where you can store your gold coins and bars in safety deposit boxes from £600 a year.
It’s safer than safe. The walls, floor and ceiling are lined with steel. To ensure there’s no risk of a Hatton Gardens Heist repeat (when a gang stole around £14 million worth of cash and jewels from London’s diamond quarter on the 2015 Easter weekend) they have security guards watching the security guards.
Managing director Sean Hoey told me demand is soaring. ‘Growing numbers of investors from all around the world are buying physical gold – and promptly locking it in a safety deposit box,’ he says.
But buying solid gold may not be the best option
For anyone wanting to invest in gold, buying lumps of it is one of the least practical options.
First, you have to find a seller and pay for the gold to be delivered to you.
Then you must decide whether to risk keeping it at home, where it could be stolen, or pay to keep it somewhere safe.
The gold must also be mined of course – with all the environmental and social damage that can entail.
If you’re looking for an investment in gold there are plenty of easier and cheaper options.
You can buy a fund on an investment platform in seconds that tracks the gold price – and for just 0.12 per cent a year. You can invest as much or as little as you like – unlike with physical gold where it’s harder to buy small amounts.
But part of the attraction of gold is its physicality – especially when we become less confident about what the future holds.
Share prices could fall, whole stock markets could crash, governments could collapse and social structures deteriorate. The future could look very different to what we’d imagined. But that physical gold in your pocket or in a vault will remain unchanged.
Of course, even gold is not a guaranteed way of holding wealth into the future. You could always lose it. And it only has value when you come to sell.
So if gold isn’t an assured store of wealth, is anything?
I wonder if the safest store is…us. There is no guarantee of what we can take into the future. But developing our skills and broadening our networks should help us to continue to work, earn and therefore increase our wealth in the future. And investing in our friendships and communities will enrich the journey – even if our financial wealth is uncertain.

Losing value: Beautiful furniture is being practically given away – often selling at a fraction of the cost of flatpack
What happened to family antiques?
If you need to know the going rate for a Victorian police truncheon or a taxidermy trout – I’m the woman you’re looking for.
For the past couple of years, I’ve become increasingly intrigued by online antique auctions. I rarely buy, but I always look at how much things go for. And the value we put on objects fascinates me.
I think about how much families must have paid for these mahogany cabinets, gilded mirrors and ornate dinner services when they were new. They would have cost a fortune and no doubt have been prized possessions.
If my auction perusing observations are anything to go by, little is worth anything very much these days.
Beautiful furniture is being practically given away – often selling at a fraction of the cost of flatpack.
Whenever I do buy something from an auction, the delivery typically costs more than the item itself.
Perhaps tastes will change one day and the value of middle-of-the-road antiques will rise again. But I’d be prepared for the possibility that it won’t.
A woman in her fifties confided in me last month that she didn’t have much in her pension, but didn’t seem too worried. ‘I’ve got a few bits and bobs I can probably sell – furniture and things that belonged to my parents and that I’ve bought over the years,’ she said.
I hope she’s right and they’ve held value.
I urged her to top up her pension – just in case.
DIY INVESTING PLATFORMS
AJ Bell

AJ Bell
Easy investing and ready-made portfolios
Hargreaves Lansdown
Hargreaves Lansdown
Free fund dealing and investment ideas
interactive investor

interactive investor
Flat-fee investing from £4.99 per month
Saxo
Saxo
Get £200 back in trading fees
Trading 212
Trading 212
Free dealing and no account fee
Affiliate links: If you take out a product This is Money may earn a commission. These deals are chosen by our editorial team, as we think they are worth highlighting. This does not affect our editorial independence.
Compare the best investing account for you