Share this @internewscast.com

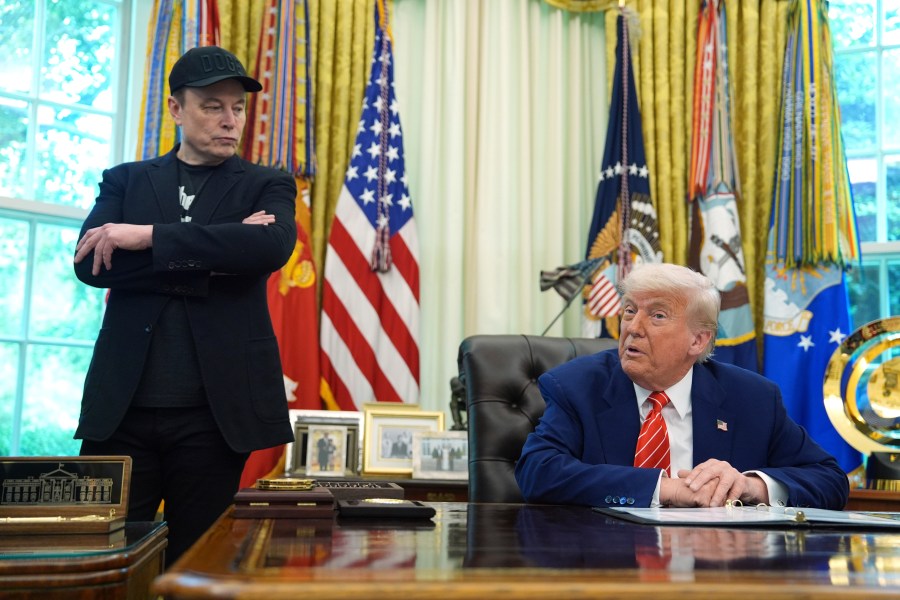
Elon Musk has taken a step back from his intense clash with U.S. President Donald Trump, expressing regret on X about some of his previous postings regarding his former ally.
Early Wednesday morning, he posted “I regret some of my posts about President @realDonaldTrump last week. They went too far.”
Musk’s rift with a president for whom he invested hundreds of millions to support appeared to end his sway within the White House, raising concerns about potential repercussions for his companies. As a significant government contractor, Musk’s enterprises could be particularly susceptible to retaliation, with Trump already warning about revoking Musk’s contracts.
Previously, Musk removed a post where he baselessly claimed the government was hiding details about the president’s connection to the infamous pedophile Jeffrey Epstein. However, other posts that irked Trump, including those where Musk labeled the spending bill as an “abomination” and took credit for Trump’s election victory, are still available.
On Sunday, Trump told NBC’s Kristen Welker that he has no desire to repair their relationship and warned that Musk could face “ serious consequences ” if he tries to help Democrats in upcoming elections.
Shareholders of Tesla, Musk’s electric vehicle company, have been closely watching his feud with Trump. In a separate post late Tuesday on X, Musk said Tesla’s rollout of robotaxi service in Austin, Texas, is “tentatively” scheduled for June 22. Wall Street analysts have expressed concern that Trump could retaliate against Musk by having federal safety regulators impede a broad rollout of the service, which is seen as a key to Tesla’s future.
Tesla shares rose almost 2% in early trading Wednesday and have regained all of the big loss from last Thursday when the Trump-Musk feud erupted.