
Share this @internewscast.com
(EDITOR’S NOTE: This story has been corrected. The dashboard is not affiliated with the Deportation Data Project.)
McALLEN, Texas (Border Report) — A new online dashboard now provides real-time information on immigrant arrests and removals carried out by U.S. Immigration and Customs Enforcement.
The Immigration Enforcement Dashboard monitors and consolidates intricate data regarding case arrests, detentions, and deportations across the United States, with records starting from September 2023.
Data reveals that since President Donald Trump assumed office in January and up to July 29, there have been 138,068 arrests. From September 1, 2023, onward, there have been a total of 291,668 arrests.
Monthly arrests peaked in June, at 30,390, and dropped to 23,617 in July, which is the second-most monthly arrests so far during Trump’s second term.

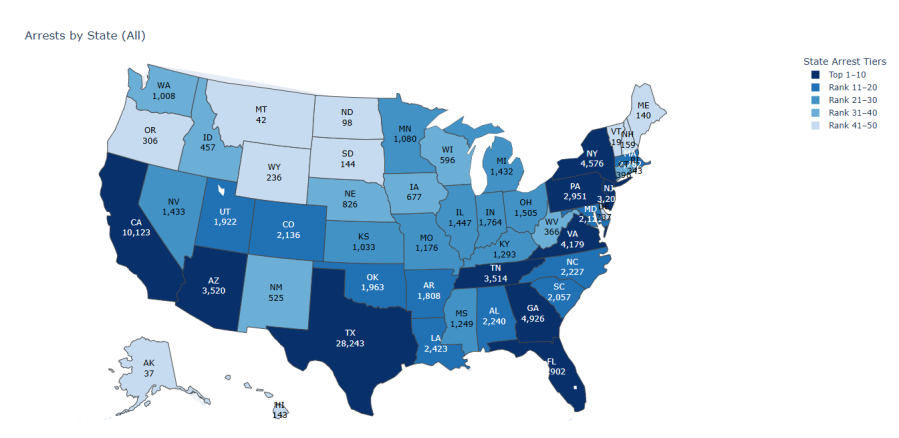
Most of the arrests since January have occurred in Texas — 28,243, according to the data.
Southwest border states like California and Arizona have reported significant numbers of arrests, with 10,123 and 3,520 respectively. Other states ranking in the top 10 for immigrant arrests include:
- Florida: 12,902
- Georgia: 4,926
- New York: 4,576
- Virginia: 4,179
- Tennessee: 3,514
- New Jersey: 3,202
- Pennsylvania: 2,951
In Miami, ICE officers have conducted the highest number of arrests since January 20 — over 15,500, which accounts for about 11% of all nationwide arrests, according to the data. Officers in the New Orleans area, encompassing Alabama, Arkansas, Louisiana, Mississippi, and Tennessee, have made 11,436 arrests.
Areas in South Texas through ICE’s Harlingen office accounted for 3.8% of nationwide arrests — over 5,200, according to the data.
The data also drills down by age of arrest, citizenship, gender and criminal history.
Sandra Sanchez can be reached at SSanchez@BorderReport.com.